



Amazon ECS Deployment Observability Is Here: How to Catch a Failing Rollout Before It Costs You Six Figures an Hour
ITIC’s 2024 Hourly Cost of Downtime Survey found that more than 90 percent of midsize and large enterprises now lose over 300,000 dollars for every hour their systems are down, and 41 percent put that figure between 1 million and 5 million dollars. Most of those outages are not caused by hardware faults or data centre fires. They are caused by a change someone pushed to production. So when AWS quietly shipped real-time deployment observability for Amazon ECS on 1 July 2026, it addressed one of the most expensive blind spots in day-to-day operations: the gap between a deployment going wrong and someone actually noticing.
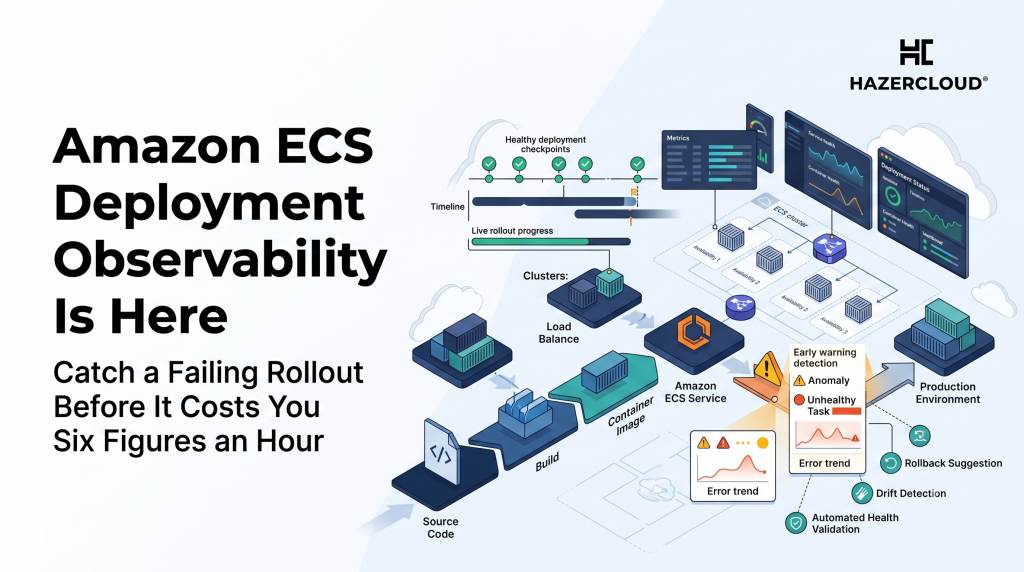
If you run services on ECS, the short version is this. You can now watch a deployment happen live inside the ECS console, with a timeline that shows each phase, service events, and every task launching or terminating, refreshing automatically as it goes. You can see circuit breaker status, how close you are to the failure threshold, deployment alarm state, and health checks at both the container and load balancer level. Failed tasks appear in the timeline with diagnostic context attached. It is available at no extra charge in all commercial Regions and GovCloud (US) for any ECS service using the rolling update deployment type. In practice, it turns a bad rollout from something you discover through a pager alert into something you watch fail and stop.
Why a Slow Rollout Is Really an Expensive Rollout
The reason this matters is not the feature itself, it is what a delayed reaction to a failing deployment actually costs. The research on downtime is consistent and sobering. EMA Research’s 2024 analysis puts average unplanned downtime at 14,056 dollars per minute across organisations of all sizes. For large enterprises, BigPanda’s 2024 numbers land at roughly 23,750 dollars per minute, which works out to about 1.4 million dollars an hour. Those are not abstract figures. Every minute a broken deployment sits in production unnoticed is a minute being billed at that rate.
The industry has quietly agreed that this is a change-management problem, not a luck problem. The 2024 DORA State of DevOps report renamed its old mean-time-to-recover metric to failed deployment recovery time, and the reasoning was deliberate. The old definition lumped together outages caused by data centre failures and outages caused by someone shipping a bad change. The new metric measures only the second kind: how long it takes you to restore service after a change to production broke something. That is exactly the window ECS deployment observability is designed to shrink.
What the Numbers Say About Failed Deployments
Failed deployments are not rare events at the tail of the distribution. They are a routine, measurable part of shipping software. DORA’s change failure rate benchmarks, as summarised by Octopus Deploy, put elite performers at around 5 percent, high performers at 10 percent, and medium performers at 15 percent. Read that plainly: even a strong team expects roughly one in every ten to twenty deployments to need a rollback or a hotfix. The question is never whether a deployment will fail, it is how fast you see it and how fast you stop it.
Here is what the exposure looks like once you connect failure rates to downtime cost. The table below pulls per-hour outage costs by sector from published 2024 research so you can size your own risk against real numbers rather than a gut feeling.
| Sector | Reported cost of downtime per hour | What drives the cost |
|---|---|---|
| Finance and banking | 1 million to 9.3 million dollars | Transaction processing, regulatory fines |
| Automotive | 2.3 million dollars | Assembly line stoppages |
| Retail and e-commerce | 1 to 2 million dollars at peak | Lost sales, customer churn |
| Telecommunications | 660,000 dollars and above | Service credits, customer churn |
| Healthcare | 318,000 to 540,000 dollars | Patient safety, HIPAA violations |
| Manufacturing | 260,000 to 500,000 dollars | Supply chain disruption, production delays |
| Cross-industry average | About 843,000 dollars (14,056 dollars per minute, EMA 2024) | Combined revenue, productivity, and recovery cost |
The figures come from the ITIC 2024 Hourly Cost of Downtime Survey, EMA Research 2024, BigPanda 2024, and DORA 2024 by way of Octopus Deploy, all retrieved on 4 July 2026. A caveat worth stating: these sources use different sample sizes and different definitions of what counts as downtime, so treat them as an order-of-magnitude guide, not a precise quote. The pattern across all of them is the same. A failed deployment that runs unattended for even a few minutes is one of the most expensive things that can happen in a normal working day.
What Deployment Observability Actually Changes
The old ECS deployment experience gave you a status and not much else. You kicked off a rolling update, watched a spinner, and found out something was wrong when tasks kept cycling, alarms fired, or a customer complained. The circuit breaker would eventually roll you back, but “eventually” is doing a lot of work in that sentence, and by then you were already deep into your failed deployment recovery time.
The new observability changes the shape of that experience in three concrete ways. First, the live timeline means you no longer have to correlate CloudWatch alarms, service events, and task state by hand while under pressure. It is all in one view, updating as the deployment runs. Second, the circuit breaker status now shows live task failure proximity and threshold tracking, so you can see a deployment drifting toward rollback before it actually trips, which is the difference between reacting and pre-empting. Third, failed tasks show up in the timeline with diagnostic context, so the first question during an incident, “which task died and why,” has an answer sitting right in front of you instead of buried three clicks deep in a log group.
Pair this with the high-resolution metrics AWS shipped for ECS service auto scaling earlier this year, which brought 20-second metric resolution so scaling reacts to load changes far faster than the old one-minute cadence, and you get a much tighter feedback loop overall. Faster scaling signals plus a live deployment view means the platform is finally giving operators the same real-time picture during a change that they have long had during steady-state running.
What to Do About It
Turning this feature on is free, but getting value from it takes a small amount of deliberate work. Start by confirming which of your services use the rolling update deployment type, because that is the only type covered today. Then treat the deployment timeline as a first-class part of your release runbook, not an afterthought. The next time you ship a non-trivial change, have someone actually watch the timeline rather than starting the deploy and walking away, and use the circuit breaker proximity indicator as your early-warning line rather than waiting for the automatic rollback.
Beyond the console, wire your deployment alarms so the circuit breaker has meaningful signals to act on, because the observability view is only as good as the health checks and alarms behind it. If your health checks are shallow, a deployment can look green in the timeline while quietly serving errors. And measure yourself. Pick failed deployment recovery time as a metric your team actually tracks, use the timeline to see where the minutes go during a bad rollout, and drive that number down deliberately. The teams that recover in minutes rather than hours are not luckier, they are watching.
If your ECS deployments still feel like flying blind, or you want deployment health, auto scaling, and alarms configured so this observability layer has something real to show you, HAZERCLOUD can help. We design and run production AWS platforms for founders and engineering teams who cannot afford a six-figure outage from a routine release. Book a free consultation at https://hazercloud.com/contact/ and we will review your current deployment setup and show you where the risk actually sits.
