


Amazon ECS Action Logs: How to See Every Deployment Decision Before a Bad Rollout Becomes an Outage
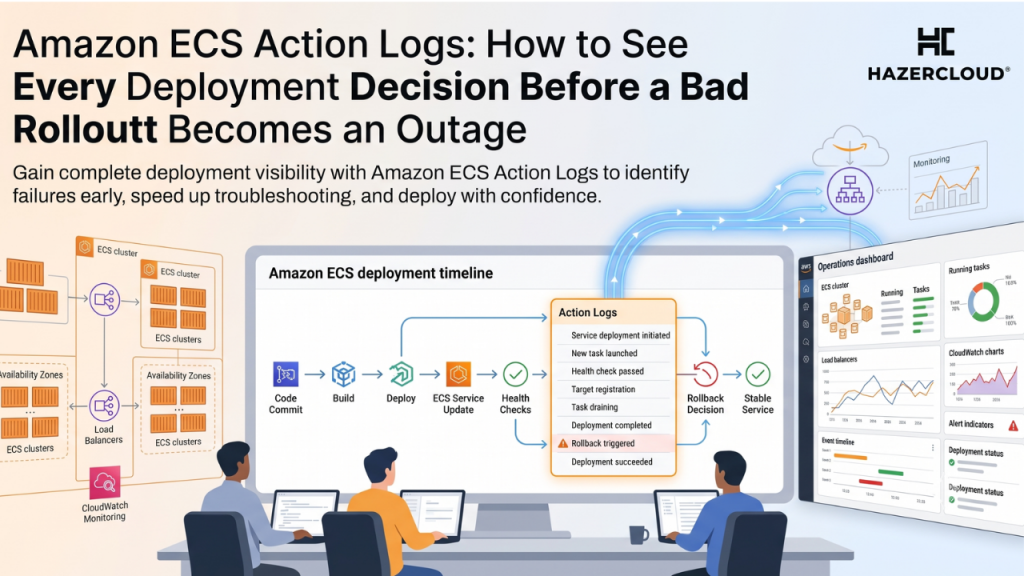
When an Amazon ECS deployment stalls or quietly rolls back, the hardest question is usually the simplest one: what did ECS actually do, and why. Until now the orchestrator made its decisions in the dark. It drained a task, waited on a health check, held a deployment, or reverted a service, and all you saw on your side was a service that would not go green. On July 21, 2026 AWS closed that gap by launching Amazon ECS Action Logs, a feature that writes down the actions ECS takes on your behalf during service deployments and Managed Daemon updates. For any business running production workloads on ECS, this is the difference between guessing at a failure and reading the record of it.
Amazon ECS Action Logs give you a detailed, timestamped record of the orchestration actions ECS performs during a deployment, each entry tagged with an event name, a log level of INFO, WARN, or ERROR, the relevant resource ARNs, and a status reason. You opt in at the cluster level in the ECS console or through the CloudWatch vended logs APIs, and you choose to deliver the logs to Amazon CloudWatch Logs, Amazon S3, or Amazon Data Firehose. It is available in all AWS Regions, including AWS GovCloud (US). The short version is that the deployment steps ECS used to keep to itself are now yours to read, alert on, and store, which is exactly the visibility you need when a rollout goes wrong at three in the morning.
Why Deployment Blind Spots Are So Expensive
Deployment is not a side risk. It is one of the leading ways production breaks. In Uptime Institute’s 2024 outage survey, someone making a change to the environment was named a top cause of unplanned outages by 28 percent of operators, and deploying software changes by 27 percent, putting change and release work close behind network failure at 35 percent. In Europe and the Americas the change figure rose to 32 and 31 percent, ahead of most other causes. These are not edge cases. They are the normal texture of running software, and they cluster around the exact moment ECS is shuffling tasks in and out.
The cost of getting that moment wrong has climbed. ITIC’s 2024 Hourly Cost of Downtime survey, which polled more than 1,000 firms worldwide, found that a single hour of downtime now exceeds $300,000 for more than 90 percent of mid-size and large enterprises. Uptime Institute’s data tells the same story from a different angle: 54 percent of operators said their most recent significant outage cost more than $100,000, and 20 percent said it cost more than $1 million, a four point year on year increase. When a deployment is the thing that took you down, every minute you spend reconstructing what ECS did is a minute billed at those rates.
The Real Problem Was Never the Failure, It Was the Silence
Before Action Logs, troubleshooting a stuck ECS deployment meant stitching a story together from fragments. You had CloudWatch metrics that told you something was wrong, task state that told you where you ended up, and application logs that told you what your code did, but nothing that told you what the orchestrator decided and why. Teams filled that silence by opening AWS Support cases or by manually correlating timestamps across three or four consoles, and that reconstruction work is where the clock runs.
The numbers on resolution time show how much room there is to improve. New Relic’s 2024 Observability Forecast found that the median mean time to resolution for high business impact outages was 51 minutes, and that 39 percent of respondents put their MTTR for those incidents at an hour or more. The same report found that teams who had achieved full-stack observability spent 76 percent fewer hours resolving outages across the year, 41 hours against 168. Action Logs are a piece of that full-stack picture for the container layer. They do not fix a bad deployment, but they remove the part of the incident where you are simply trying to work out what happened.
What Action Logs Actually Show You
Each Action Log entry records a deployment or orchestration event with a level attached, so an ERROR line stands out from routine INFO chatter and can be alerted on directly. Because entries carry resource ARNs and a status reason, you can see not just that ECS held or reverted a deployment, but the stated reason it did so, and against which task or service. That is the field that usually ends the guessing. A deployment that never reaches steady state stops being a mystery and becomes a readable sequence of state transitions with reasons attached.
The delivery choices matter for how you use them. Sending Action Logs to CloudWatch Logs lets you build metric filters and alarms on ERROR-level events, so a failing rollout can page someone the moment ECS flags it rather than after a customer does. Sending them to S3 gives you a durable, queryable audit trail for post-incident review and for the change records that auditors and enterprise customers increasingly ask to see. Firehose lets you fan the stream into an existing analytics or SIEM pipeline. You pay standard CloudWatch Logs, S3, or Firehose rates for ingestion and storage, so the cost is the cost of the destination you already understand, not a new premium feature line.
Where This Fits in a Sane Deployment Strategy
Action Logs are most valuable when they are wired into detection rather than read after the fact. The observability data is blunt about this. New Relic found that teams who learned about interruptions through observability, rather than manual checks, had 69 percent fewer annual outages, and teams with more unified telemetry had 77 percent fewer. The point is not to collect Action Logs and let them sit in a bucket. It is to route the ERROR and WARN events into the same alerting path that already wakes your on-call, so the orchestrator’s own account of a bad rollout reaches a human early.
It also gives you a cleaner way to reason about deployment quality over time. DORA’s 2024 research puts an elite change failure rate at around 5 percent, meaning roughly one deployment in twenty needs a rollback or hotfix. If you cannot see why your ECS deployments fail, you cannot drive that number down. A stored history of Action Logs turns a vague sense that deployments are flaky into a set of specific, repeated failure reasons you can actually fix, whether that is an aggressive health check, a slow-draining connection, or a task definition that never had enough headroom.
What Deployment and Change Failures Cost, and What Observability Recovers
The figures below are drawn from four independent 2024 industry sources, retrieved on July 23, 2026. They are not ECS-specific, but they frame why a deployment-level audit trail is worth turning on.
| Metric | Figure | Source |
|---|---|---|
| Mid-size and large enterprises where one hour of downtime tops $300,000 | Over 90% | ITIC 2024 Hourly Cost of Downtime Survey |
| Operators whose most recent significant outage cost over $100,000 | 54% | Uptime Institute 2024 |
| Operators whose most recent significant outage cost over $1 million | 20% | Uptime Institute 2024 |
| Unplanned outages caused by someone making a change to the environment | 28% | Uptime Institute 2024 |
| Unplanned outages caused by deploying software changes | 27% | Uptime Institute 2024 |
| Median MTTR for high business impact outages | 51 minutes | New Relic 2024 Observability Forecast |
| Teams whose high-impact MTTR runs an hour or more | 39% | New Relic 2024 Observability Forecast |
| Fewer hours per year resolving outages with full-stack observability | 76% (41 vs 168 hours) | New Relic 2024 Observability Forecast |
| Elite change failure rate benchmark | Around 5% | DORA 2024 State of DevOps |
Read together, these say something simple. Change and deployment are common ways production breaks, the breaks are expensive, and the teams that see more recover faster and break less often. Action Logs put the container orchestrator inside that picture.
What to Do About It
If you run services on ECS, turn Action Logs on at the cluster level for your production clusters and pick a delivery destination that matches how you already work. Route the logs to CloudWatch Logs if your alerting lives there, and add a metric filter and alarm on ERROR-level events so a failing deployment notifies your on-call directly. Send a copy to S3 if you need a durable audit trail for compliance or customer assurance. Then spend a review cycle reading the reasons behind your last few failed or slow deployments, because that history is where you will find the health check, drain, or capacity setting that keeps biting you. None of this requires re-architecting anything. It is a configuration change that converts an invisible part of your platform into evidence.
If your team is stretched thin or your ECS setup has grown organically and nobody is quite sure how the deployments behave under stress, this is the kind of work that pays for itself the first time it saves an incident. HAZERCLOUD helps UK, US, and European businesses run AWS the way it should be run, with the observability, security, and cost discipline that keep production boring. If you want a second set of eyes on your ECS deployments, your alerting, or your wider AWS estate, book a free consultation and migration assessment at https://hazercloud.com/contact/ and we will help you turn deployment guesswork into something you can measure.
