



AWS Security Hub Now Maps the Blast Radius of an Exposed Resource: How Impact Analysis Ends Severity Guesswork
Every security team running on AWS knows the same quiet problem. The findings queue is full, the severity labels look plausible, and nobody can honestly say which of the forty open items would actually hurt the business if an attacker picked it up tomorrow. A public S3 bucket with nothing in it and a public S3 bucket attached to a role that can assume three other roles look identical on a dashboard. They are not identical. One is noise and the other is a path to your production database. On 6 July 2026 AWS shipped impact analysis for Security Hub exposure findings, and it is the first native AWS capability that tells you which is which.
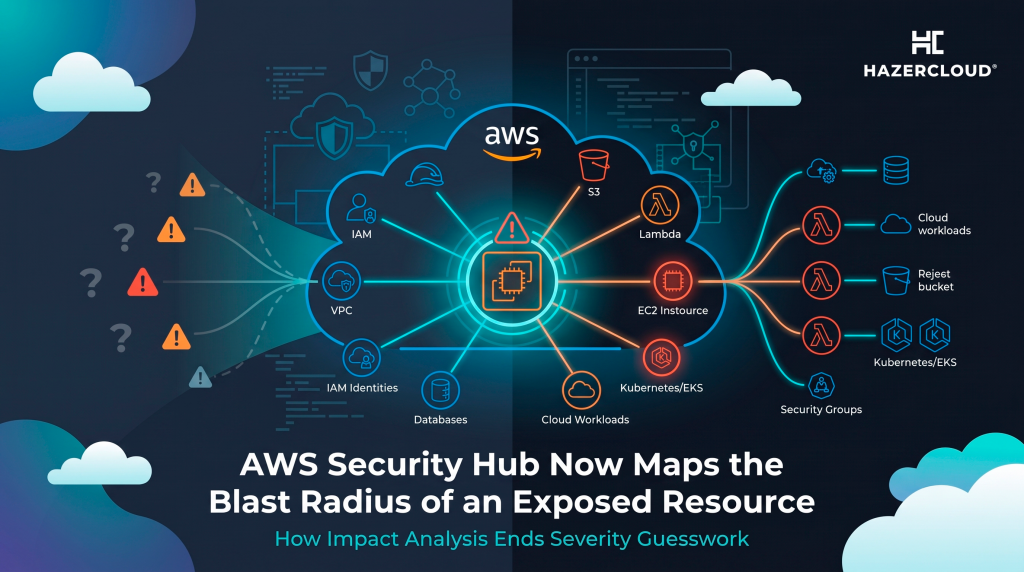
The short answer is this. AWS Security Hub Impact Analysis extends an exposure finding beyond the exposed resource itself by evaluating the effective permissions of the IAM principals attached to that resource, then mapping the chain of downstream resources an attacker could reach through privilege escalation. Security Hub renders that chain in a potential attack path graph and a new Impact Assessment tab, and it feeds the size of that blast radius back into the severity score, so an exposure with deep downstream reach is automatically prioritised above one that dead ends. In practice, AWS Security Hub Impact Analysis helps you stop triaging findings by how alarming they sound and start prioritising them by how far they actually lead.
Why Severity Scores Were Always Lying to You
A conventional finding scores the resource in isolation. It sees an open security group, or an unpatched instance, or a role with a wildcard action, and assigns a number based on the shape of that single object. What it never sees is the thing that determines actual risk, which is what that object is connected to.
The data on this is unambiguous and it has been for years. Palo Alto Networks Unit 42 analysed more than 680,000 identities across 18,000 cloud accounts at 200 organisations and found that 99 percent of cloud users, roles, services and resources had been granted excessive permissions that went entirely unused for 60 days or more. The same research found that cloud provider managed policies carry 2.5 times more permissions than customer managed ones, and that most teams reach for the built in policy because it is there. That is the raw material of a privilege escalation chain. Almost every identity in almost every account is carrying more authority than it needs, which means almost every exposed resource is a potential launch point rather than a cul de sac.
Datadog’s 2025 State of Cloud Security study adds the credential half of the picture. It found that 59 percent of AWS IAM users had an access key older than one year. Long lived keys are the connective tissue attackers use to turn one foothold into many, and they are sitting in more than half of the IAM user population.
Meanwhile the attackers are doing exactly what the permission graph invites them to do. Verizon’s 2025 Data Breach Investigations Report, drawn from 22,052 incidents and 12,195 confirmed breaches, put credential abuse at 22 percent of initial access vectors and exploitation of vulnerabilities at 20 percent, the latter up 34 percent year on year. System intrusion accounted for 53 percent of breaches, up from 36 percent two reporting periods earlier. These are not smash and grab numbers. They are the numbers of patient lateral movement through permissions nobody audited.
What Impact Analysis Actually Computes
Security Hub already produced exposure findings, which correlate a misconfiguration, a vulnerability and a network reachability signal into a single item rather than three unrelated ones. Impact analysis is the layer on top. When Security Hub identifies an exposed resource, it now walks the effective permissions of the IAM principals associated with it. Effective permissions is the operative phrase, because it means the union of identity policies, resource policies, permission boundaries and service control policies as they actually resolve, not as they read in isolation.
From that walk it produces an ordered chain. Compromise this internet facing task, assume this task role, and that role can pass this other role, which can read this secret, which unlocks this database. The Impact Assessment tab shows each hop and the specific permission that makes the hop possible. That last detail matters more than the graph itself, because it converts a scary picture into a work item. You do not need to redesign your IAM estate. You need to remove one iam:PassRole on one role, and the chain breaks.
The Numbers That Justify the Work
The financial case for shortening detection and containment is now well measured. IBM’s 2025 Cost of a Data Breach Report, based on 600 organisations researched by the Ponemon Institute, put the global average breach cost at 4.44 million US dollars, down 9 percent year on year, with the decline driven specifically by faster identification and containment. The US average went the other way, to 10.22 million dollars. Organisations that contained a breach inside 200 days averaged 3.87 million dollars against 5.01 million for those that did not, a premium of 1.14 million dollars for being slow.
Impact analysis does not detect breaches. It does something arguably more valuable, which is to reorder the queue so that the exposures capable of producing a 5 million dollar incident get fixed before the ones that cannot. Here is the sourced picture that argument rests on.
| Metric | Figure | Source |
|---|---|---|
| Cloud identities with excessive, unused permissions (60+ days) | 99% of 680,000 identities analysed | Unit 42 IAM cloud threat research |
| Cloud provider managed policies vs customer managed, permission breadth | 2.5x more permissions | Unit 42 IAM cloud threat research |
| AWS IAM users with an access key older than one year | 59% | Datadog 2025 State of Cloud Security |
| Credential abuse as initial access vector | 22% of breaches | Verizon 2025 DBIR |
| Exploitation of vulnerabilities as initial access vector | 20% of breaches, up 34% YoY | Verizon 2025 DBIR |
| Breaches taking the form of system intrusion | 53% | Verizon 2025 DBIR |
| Global average cost of a data breach, 2025 | 4.44m USD, down 9% YoY | IBM Cost of a Data Breach 2025 |
| Cost premium for breaches contained after 200 days | 1.14m USD (5.01m vs 3.87m) | IBM Cost of a Data Breach 2025 |
| Mean time to identify and contain a breach | 241 days | IBM Cost of a Data Breach 2025 |
Read those rows together and the shape of the problem is clear. Nearly every identity is overprivileged, more than half of IAM users carry a stale key, a fifth of breaches start with stolen credentials, and slowness costs a million dollars. A tool that tells you which exposure leads somewhere expensive is not a nice to have.
Where Teams Will Get This Wrong
The first mistake will be treating the attack path graph as a report to admire rather than a backlog to burn down. A graph that nobody converts into pull requests is a very sophisticated way of documenting your own negligence.
The second mistake is scope. Impact analysis evaluates privilege escalation paths to other resources in your account. If your blast radius crosses an account boundary through a cross account trust policy, and in any mature AWS Organizations setup it does, you still need to reason about that yourself. Datadog found that 86 percent of companies use multiple accounts inside an AWS Organization. The graph you are shown is one account’s worth of a story that spans several.
The third mistake is assuming this replaces least privilege work. It does not. It ranks the consequences of not having done least privilege work. Those are different things, and only one of them fixes the underlying condition.
What to Do About It
Turn on Security Hub exposure findings if you have not, and give impact analysis two weeks to populate. Then take the top ten findings by scope of impact, not by severity label, and for each one identify the single permission in the chain that is cheapest to remove. In most estates that permission will be an unused iam:PassRole, a wildcard resource on a customer managed policy, or an access key belonging to a human who now uses SSO. Remove it, watch the chain shorten in the graph, and you have a before and after your board can read.
Then close the loop on the credential half. Inventory IAM access keys older than 90 days, not one year, and kill them. If 59 percent of IAM users across the industry are carrying a key older than twelve months, the probability that your estate is clean is low.
Finally, extend the reasoning across accounts by hand until AWS does it for you. Enumerate every cross account trust in your Organization and ask the same question impact analysis asks: if this principal were compromised, what does it reach next.
If you are running production on AWS and you are not sure whether your exposure findings are ranked by real blast radius or by how loud they sound, HAZERCLOUD can help. We run AWS security and Well-Architected reviews for founders and engineering leaders across the UK, Europe and the US, and we turn IAM permission graphs into a short, ordered list of things to fix. Get in touch for a free consultation or migration assessment and we will tell you what your blast radius actually looks like.
